News
Calculating Shift Points March 31, 2016 03:53 2 Comments
A question we get asked nearly every time we dyno a car is "where should i be shifting at?" This question is actually quite easy to determine and i will use a couple of our good customers cars as reference points. Before we start going through the math of calculating the shift point, we will look at the three cars we are going to compare.
First up, is a road race car we built and support.
The car:

The car is a 2.3L stroker motor, with a stock evo 9 turbo, and a short ratio 5 speed (JDM 5th gear). the car also runs 275x35x18 tires. This car dynoed 397whp.
The dyno sheet:

Next on the list is a local drag race/street car.

this car is sporting the stock 2.0L motor, with a 4.11 final drive and stock 8 gear ratio setup, with a FP red equivalent turbo, making 533 whp. Hes running a 255x40x17 tire setup.
The dyno sheet:

The last car we will compare is a well known car affectionately known as "Ricebox".

Ricebox is also a 2.0L motor, with a precision 6466 turbo, shep ultimate ratio transmission also with a 4.11 final drive. This car makes 722whp at full boost.
The dyno sheet:

The first step of determining the shift points is to understand the gear ratios and tire size of each car and how that translates to the actual torque applied to the ground. i have put the data into a small table below:
| gear | Road Race Car | Red Car | Ricebox |
| 1st gear | 2.785 | 2.928 | 2.785 |
| 2nd gear | 1.95 | 1.95 | 1.95 |
| 3rd gear | 1.444 | 1.407 | 1.407 |
| 4th gear | 1.096 | 1.031 | 1.031 |
| 5th gear | 0.825 | 0.72 | 0.761 |
| final drive | 4.53 | 4.11 | 4.11 |
| tire diameter (in) | 25.6 | 25 | 25.5 |
With the ratios in hand, we next want to break down the dyno sheets for each car. for simplicity sake, we will use 250 rpm increments, and we want to look at the torque value.
| rpm | Road Race Car | Red Car | Ricebox |
| 3500 | 430 | 183 | 96 |
| 3750 | 467 | 224 | 96 |
| 4000 | 465 | 273 | 99 |
| 4250 | 451 | 315 | 134 |
| 4500 | 432 | 394 | 172 |
| 4750 | 423 | 425 | 211 |
| 5000 | 412 | 432 | 271 |
| 5250 | 398 | 440 | 331 |
| 5500 | 375 | 444 | 417 |
| 5750 | 361 | 442 | 463 |
| 6000 | 340 | 439 | 508 |
| 6250 | 322 | 433 | 526 |
| 6500 | 300 | 419 | 531 |
| 6750 | 285 | 406 | 532 |
| 7000 | 268 | 397 | 524 |
| 7250 | 253 | 385 | 512 |
| 7500 | 241 | 365 | 497 |
| 7750 | 230 | 353 | 488 |
| 8000 | 219 | 342 | 474 |
There are two things to understand when looking at the dyno results from a chassis dyno. We are using a Dynojet 424x inertia dyno. First, the dyno by its nature takes into consideration all driveline losses. The power is measured by what the tires puts down on the roller. Second, the dyno does NOT measure what is commonly called "wtq" or "wheel torque". I honestly don't know where that "measurement" came from as it is not correct. a better term would be "driveline loss corrected brake torque" where the brake torque is commonly known as the torque at the engine. And since the dyno reads the horsepower after the driveline losses and calculates the torque from that based on engine speed, the dynos displayed torque is simply what is seen at the engine taking into consideration those driveline losses. If that doesnt make sense, we can look at the following tables to help make this more clear.
The transmission of the car multiplies the torque the engine generates by reducing the speed. For example, in first gear the car moves very slowly, but it has a tremendous amount of torque at the tire. In 5th gear, the car will go really fast, but it has so little torque at the tire it cant even accelerate from a stop. We can visualize this for each car by plotting the vehicle speed vs the engine speed in each gear, and we create whats commonly known as a speed by gear chart.
Road Race Car:

Red Car:

Ricebox:

With the torque chart we can next use the torque multiplier of the transmission to calculate the torque at the tire in each gear. This is done by taking the torque number at each of our rpm increments and multiply it by the gear ratio and again by the final drive ratio.
Road Race Car:

Red Car:

and the Ricebox:

Our last step is to take the data from the torque vs rpm graph, and the relationship between rpm and speed for each gear to determine the torque vs vehicle speed for each gear:
Road Race Car:

Red Car:

and Ricebox:

The results of the torque vs speed graph tell us exactly at what speeds we should be shifting. Maximum acceleration for the car will always be when the highest torque is applied at the axle. so we want to follow the highest point in the graph at each speed.
Looking Closely at the road race cars chart, when the colored lines intersect is when the driver should shift. This ensures that he is riding the curve of maximum torque at the axle. I have indicated those intersect points on this graph:

Its pretty obvious that revving the 2.3 stroker motor out to redline is in fact slower then shifting early. The data shows he should be shifting from 1st to 2nd at 6750rpm (roughly 40mph), from 2nd to 3rd at 6500rpm (roughly 55mph), from 3rd to 4th at 6250rpm (roughly 75mph), and from 4th to 5th at also 6250rpm (roughly 97mph). My next study will be to do this same data set instead with a 4.11 final drive to see how it improves the torque across the speed range. We collect track data at all the local tracks and can analyze what speed ranges each track sees, so we can determine what final drive will be optimal.
For the Red Car, the curve looks a little different. there aren't any intersection points for the graphs, which means it makes sense to always run it out to at least the 8000 rpm our dataset goes to. I have drawn a red line to show what happens through a 1st-5th gear run:

There are two rather steep drop off points, the first being on the 1-2 shift, and the second on the 2-3 shift. the torque drops considerably at those points, so it would make sense to rev the engine out a little longer to maintain the gearing torque advantage. By the time this car gets through 3rd gear at 8000rpm, the torque is nearly identical to the torque in 4th gear @5900rpm, and likewise when winding out 4th gear to 8000rpm, when you shift the rpm will drop to ~5600rpm. Looking at these plots I would rev out to about 8500 in 1st and 2nd, and shift around 8200 in 3rd and 4th.
The last car is Ricebox. The graph for Ricebox has large drops between every shift. This means the larger turbo really needs to be revved out to 9000+rpm to maintain a consistent torque output at the axle. I have drawn a red line on the path of shifting at 8000rpm would land it.

Its obvious that the big turbo in Ricebox has a significant advantage vs both the road race car and the red car once it gets above 40mph.
Yuris Kouznetsov's 2014 Pikes Peak Build December 25, 2014 11:16
Pikes Peak 2014 - Yuri Kouznetsov
Yuris 2006 Mitsubishi Evo 9 started in january 2014 as a well used ASP autocross car. The goal was to convert the car to TA1 spec for the 2014 Pikes Peak International Hill climb.

We began by stripping the interior to the shell, removing weight when possible, and adding a NASA/PPIHC legal cage.

With the cage in place, RECARO has been a major supporter for us and we chose to run their HANS seat to maximize the safety inside the car.

The exterior of the car was outfitting with an APR performance GT1000 dual element wing with our own custom CNCed uprights. The front of the car was equipped with our custom front splitter made from alumalite. The body was upgraded with a APR Performance widebody kit installed and painted matte grey at Apex Autoworks in Houston.

With the car ready, it performed well at the PPIHC. Yuri on his first time driving the car placed 7th in class with an elapsed time of 11:02.
Aerodynamics Testing 1 November 23, 2014 23:04
The purpose of this test was to quantify the aero loads we are seeing on the evos we time trial and road race. There are obvious reasons to utilize aero on our race cars, but actual numbers of how effective these components may be are nearly non-existent. CFD results for a wing are great to have, but put behind the turbulent flow of the roof of the car, we would expect the real world results to differ. In the US, road racing and Time Trialing is largely grassroots so you don’t see big budget teams, and even fewer people instrumenting their cars. The few pro teams there are, keep their data to themselves as a advantage over their competitors (rightly so).
For those who don’t understand the science behind why downforce helps cars handle better, we begin at the tire. Friction between the tire and the road is what gives you the grip when cornering. This force of friction (Ff) is defined as Ff = Fn*mu, where Fn is the normal force and mu is the coefficient of friction. The coefficient of friction changes with tire compound, temperature, track surface tire pressure etc. For the purpose of simplicity, we are going to assume mu is a constant that never changes, and we are going to ignore slip angles, tire compounds, tire size etc.
The Fn value is the parameter we are playing with when it comes to aerodynamics. The normal force is the load on the tire, and as you can see by the equation, if you assume mu is constant, if you increase Fn, your Ff increases (and thus lateral grip). Its also true that if you make your car heavier, you increase the grip the tires have. There are downfalls to making your car heavier though, the first being when you look at the lateral loads needed to make a corner , with a heavier car the loads are greater (F-=m*a, where m is greater, F needs to be greater as well for the same a), therefore it takes more Ff to maintain the same lateral load as a lighter car. Make your car light, with a lot of downforce, you increase its Force of friction with the road, but don’t increase the mass for the cornering acceleration, this means greater cornering speeds.
So moving forward, we wanted to show the actual loads seen on the car by the various wings, splitters and diffusers people utilize in our sport. The first tests we conducted were more of a proof of concept of how we are measuring the loads. We outfitted the car with 4 linear potentiometers in parallel with the springs on the car. We next measured the actual spring rates of the springs. This would give us a spring load in lbf relative to the travel in inches of the potentiometers. The spring rates we measured for this test were 653lb/in for the front shocks, and 544 lb/in for the rear shocks. We know that there is not a 1:1 correlation between the spring load and the actual load on the wheel but we haven’t measured the motion ratio and spring angle yet to determine that factor.
For our aero test, we wanted to show what effect we will see at our normal race speeds. Typically, we don’t ever see cornering speeds over 100mph here in Texas, with most corners being in the 40-80mph range. We conducted the test by driving at a steady state speed measured and recorded by GPS for 1.5km in one direction, made a u-turn and came back 1.5km in the opposite direction. We tested the car at 40-60-80-100mph.
We started our testing with no wing or splitter on the car. This gives us a baseline of the natural spring load with no aero. Interestingly, in this case we weren’t able to measure any noticeable lift or downforce from the car. The ride height averages over all of the test speeds were within our range of error.
The first test we conducted was with the rear wing by itself. For this test, it was conducted at 30-60-90 before we expanded the number of test points. The results were good, showing how well an APR GTC-300 wing at max AoA can do on an evo.

When you account for the front wheels lifting slightly (and or weight transfer from the rear springs compressing more, and a torque generated from the drag), the loads show the wing makes a net downforce on the car of 61lbs@60mph and 161lbs@90mph.

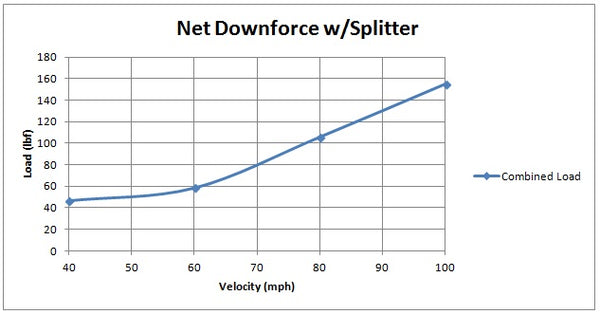
Moving on to our second test, we took the wing back off, and added the front splitter. For this test, we used the 40-60-80-100 test speeds. We were amazed by the results here, with the front splitter generating a net 154lbs at 100mph.

With both our Splitter and wing tests done individually, we would expect to see 300+lbs of downforce on the car at 100mph. we bolted the wing back on and conducted the tests.


So indeed we did see the total downforce exceed the 300lb, with it actually being 344lbs.
With the car weighing 2900lbs with the driver, we theoretically should see .12G more through corners by adding the wing and the splitter at 100mph.
